Back to Home

Support Software (Data Collection, Monitoring and Analytics)

Support software connects weather stations and dataloggers to a PC or server for programming, communication, data collection and real-time or historical display. Our range includes Campbell Scientific's LoggerNet and PC400 datalogger support software, the Stratus Weather Server multi-vendor analytics platform, our Lightning Detection System admin console, and the WeatherQuery graphical data display.


LoggerNet Datalogger Support Software.

Campbell Scientific

LoggerNet is Campbell Scientific's full-featured datalogger support software for programming, communication and data retrieval across a datalogger network. It consists of a server application and several integrated client applications. It can support a connection to a single datalogger, but it is especially suited to applications that need telecommunications or scheduled data retrieval across large datalogger networks.

LoggerNet handles network setup, configuration, monitoring and backup; datalogger programming, maintenance and data collection; and real-time or historical data display. The server stores data in a cache and writes it to a variety of formats, including ASCII, binary and XML.

RoleFull-featured datalogger support software for single stations and large networks
ArchitectureServer application with integrated client applications
ProgrammingCRBasic and Short Cut program generator
CommunicationsDirect, IP/Ethernet, phone modem, cellular, radio (RF) and other telecommunications
Data collectionScheduled, on-demand and continuous collection
Data formatsASCII, binary and XML
DisplayReal-time and historical numeric and graphical displays
Operating systemMicrosoft Windows
Visit Software Website (opens in a new tab)
Developer
Campbell Scientific

PC400 Datalogger Support Software.

Campbell Scientific

PC400 is Campbell Scientific's free datalogger support software for a single station or a simple network. It supports a variety of telecommunication options, manual data collection and data display, and it is an easy step up from the entry level without the full networking capability of LoggerNet.

PC400 includes an easy-to-use program generator (Short Cut) as well as full-featured program editors (CRBasic and Edlog). It communicates with a datalogger network over a direct connection, IP/Internet connection, phone modem or RF link.

RoleFree datalogger support software for a single station or simple network
ProgrammingShort Cut program generator, CRBasic and Edlog editors
CommunicationsDirect, IP/Internet, phone modem and RF link
Data collectionManual data collection
DisplayNumeric and graphical data display
CostFree of charge
Operating systemMicrosoft Windows
Visit Software Website (opens in a new tab)
Developer
Campbell Scientific

Stratus Weather Server Weather Station Management & Analytics.

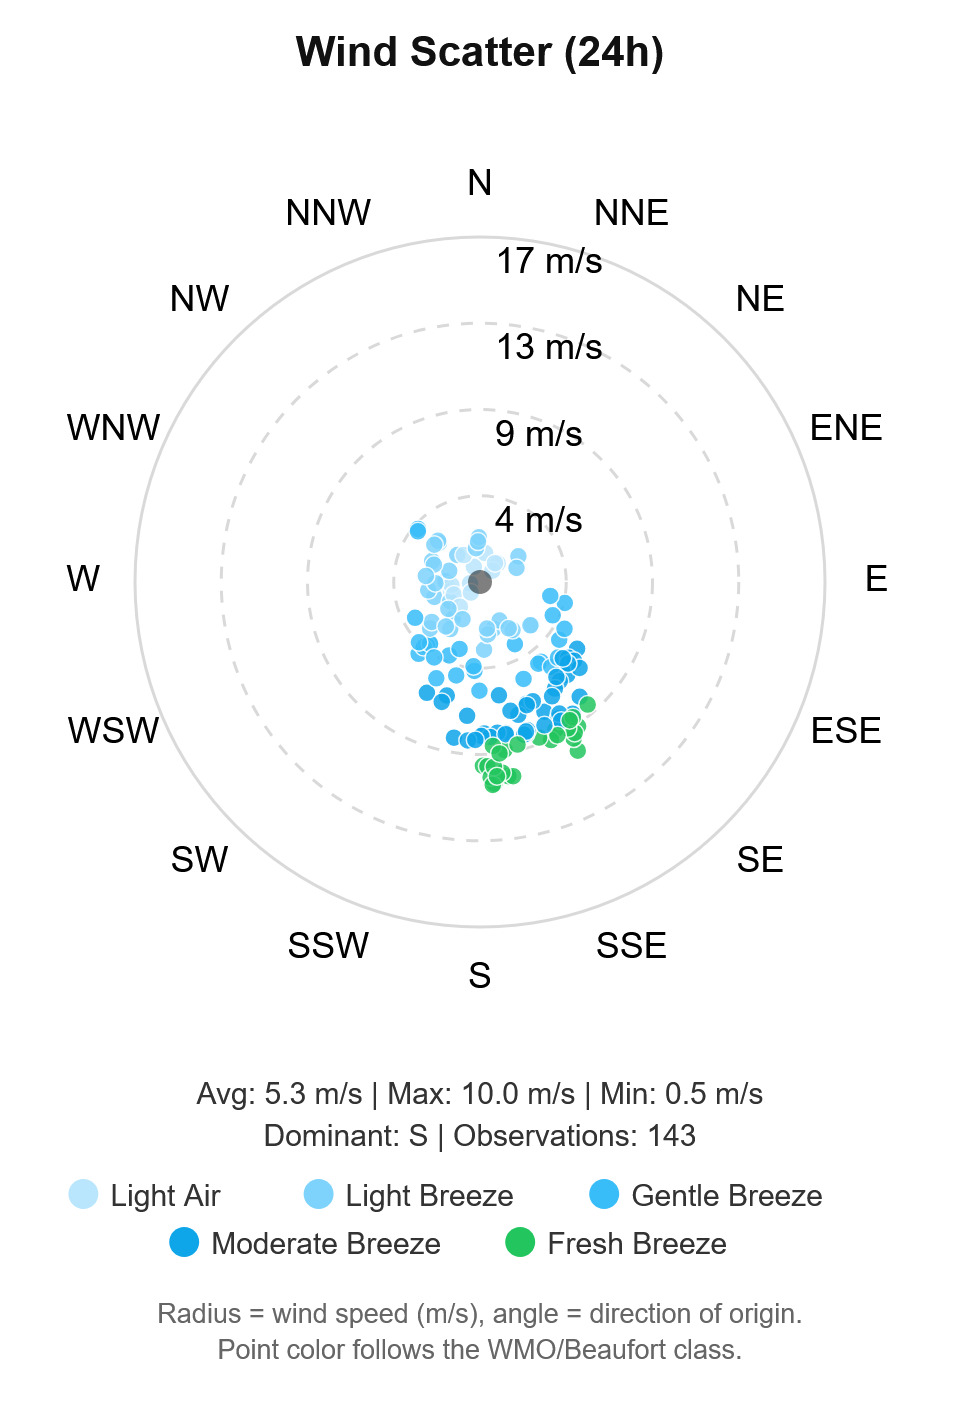
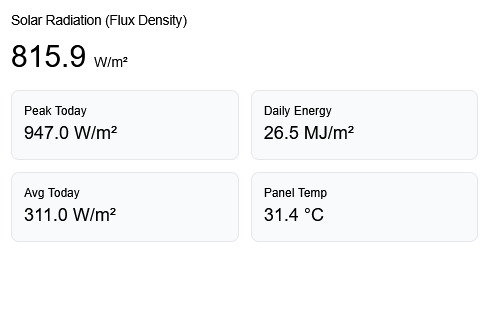
A professional, multi-vendor web application for weather station management, data collection and real-time monitoring. Stratus connects to Campbell Scientific dataloggers and a range of IoT/cloud weather platforms, then turns raw observations into rich meteorological, agricultural, aviation, fire-risk and wind-energy analytics. All station connections listed below are in production use and tested against real hardware.

Campbell Scientific (PakBus)Native PakBus implementation over TCP/IP, including clock sync and scheduled or on-demand collection
Supported dataloggersCR300, CR310, CR350, CR1000, CR1000X, CR1000Xe
Dropbox syncWatches a folder and ingests a logger export whenever it changes. This is how the cellular sites actually deliver data: the logger writes to Dropbox and Stratus reads it. Read-only; Stratus never writes to your Dropbox
HTTP POST ingestThe station pushes readings to a per-station endpoint
Manual file importTOA5 or CSV upload for bulk history
RIKA cloudv2 API
Dew PointMagnus formula when not reported by the station
Sea Level Pressure (QNH)Hypsometric adjustment from station pressure and altitude (RIKA stations that report SLP directly are handled in reverse)
Air DensityFrom temperature, pressure and humidity
Density AltitudeWith METAR-style flight-category classification
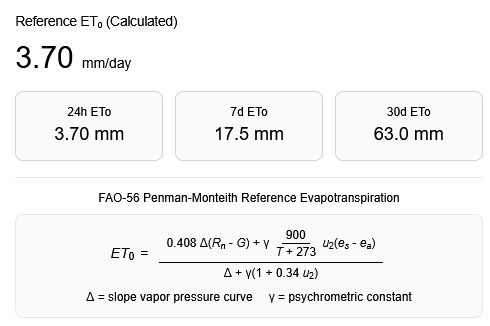
Reference Evapotranspiration (ETo)FAO-56 Penman-Monteith
Water BalanceRainfall versus ETo
Heat Index / Wind Chill / Feels-LikeApparent temperature calculations
Heat Stress (WBGT)Wet Bulb Globe Temperature
Atmospheric StabilityPasquill-Gifford stability class
Air Quality IndexAQI from PM2.5 / PM10 (e.g. RIKA particulate sensors)
Rainfall Intensity & Yearly TotalsWith per-station cumulative-counter offset correction
Weather Trend AnalysisCurrent values versus historical average
Growing Degree Days (GDD)Accumulated heat units for crop modelling
Chill UnitsAccumulated cold-hours for dormancy/fruiting models
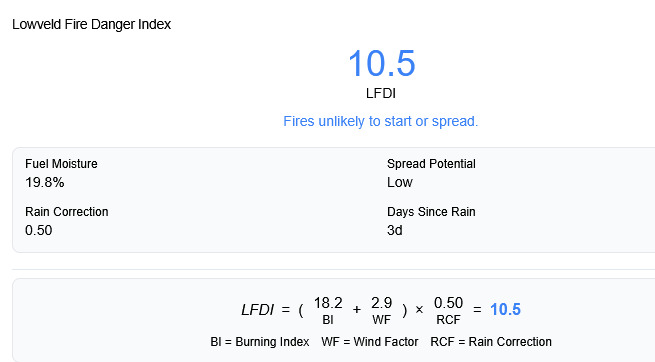
Lowveld Fire Danger Index (LFDI)Official SAWS/Namibia AFIS formula: (BI + WF) × RCF
Fire danger scoringFuel moisture estimation and component fire-danger scoring
Developer
Inteltronics Instrumentation
Stratus Weather Server screenshot 1
Stratus Weather Server screenshot 2
Stratus Weather Server screenshot 3
Stratus Weather Server screenshot 4
Stratus Weather Server screenshot 5
Stratus Weather Server screenshot 6

Lightning Detection System Admin Panel.

The web admin console for the Stratus Weather lightning detection system, managing tenants, detectors, alerting and reporting.

Multi-tenantEach client gets its own panel at /<slug>/, with a platform-level management console at the root for creating clients and assigning newly-reporting detectors
Alert configurationRecipients, groups and per-tenant alert configuration with an alert cooldown
SMS alertsSent via Clickatell, with a master on/off switch. The gateway is platform infrastructure and is not exposed in client panels
Monthly PDF reportsGenerated with WeasyPrint, including vector charts: CPU trend, distance histogram, energy bands, uptime gauge and storm activity
Event historyIncludes per-event delivery detail
Detector provisioningA detector files itself under the platform tenant on its first heartbeat and is invisible to every client panel until an admin assigns it on the platform console's Detectors page. That is deliberate rather than incidental: an unclaimed unit has no owning client, so there is no recipient list to consult and no alert is sent for it. Assigning a unit also re-files its strike history, heartbeat samples and calibration records.
POPIAA recipient's number is masked to its country prefix and last two digits before it reaches a log, because container logs are rotated to disk, swept into backups and read by platform staff who have no relationship with the client's staff. The full number stays in the message log the client is entitled to see on their own event page, scoped to their tenant.
Storm activity displayRecorded strikes are grouped into five proximity bands, nearest first, each drawn as a small cumulonimbus that flashes more often the busier the band. The block under each cloud gives the strike count with the peak, mean and lowest intensity recorded in that band.
Distance bands<= 1 km (overhead), < 10 km, < 20 km, < 30 km, 30-40 km
Time windowSelectable from 1 h to 24 h
Energy bandsLow / Moderate / High / Extreme, each a quarter of the sensor's 21-bit full scale
Distance accuracyReported in 15 discrete steps at a manufacturer-rated accuracy of ±4 km, so a strike can legitimately land in an adjacent band
Display caveatsBoth are stated on the display itself.
Bearing: the AS3935 measures distance but not bearing. Nothing in the display is placed in a compass direction, because any angle would be invented. This is why the view is a proximity ordering and not a map.
Energy: reported "energy" is a relative sensor value for comparing strikes with each other. It is not joules, and it is not calibrated to any physical unit.
Developer
Inteltronics Instrumentation
Lightning Detection System admin panel screenshot 1
Lightning Detection System admin panel screenshot 2

WeatherQuery Graphical Data Display.

WeatherQuery is a compact graphical display designer for logged data. It automates the graphical presentation of tabulated data in a flexible, application-specific way, so the end user can navigate through the data to form an impression of it. It presents live and historical weather station observations as clear charts and summary panels for display on a website or dashboard, as seen on our home page.

Display layoutUser-designed display layout using graphical components
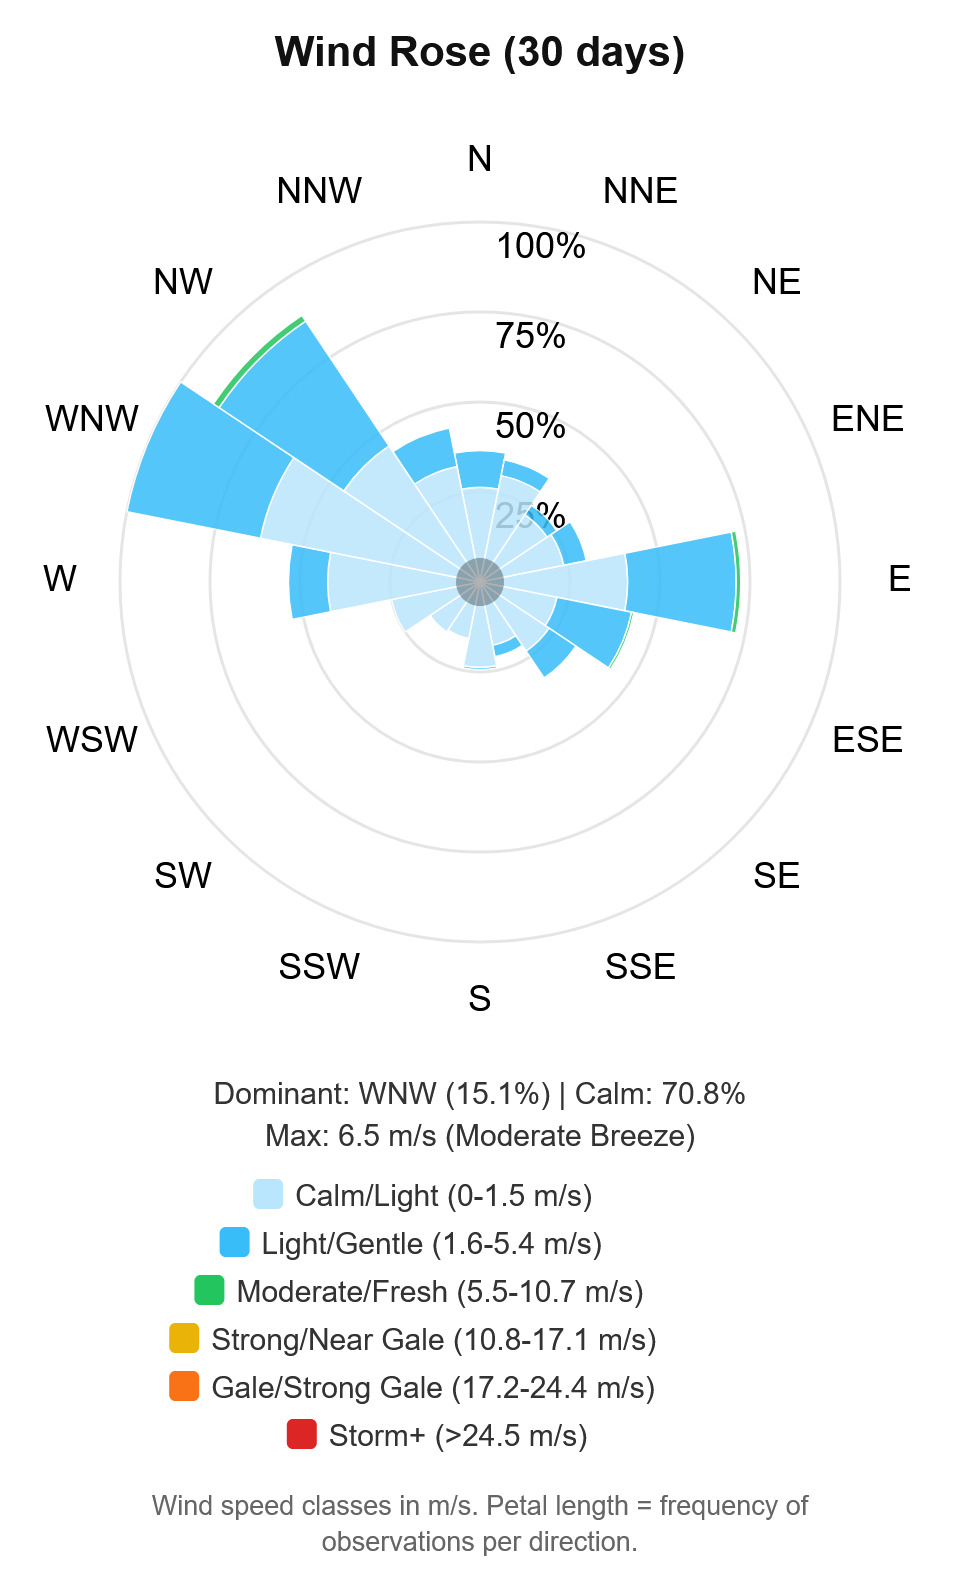
Graphical componentsChart, Rich Label and Wind Rose
Data exportPage / component captures
Scheduled / conditional email reports
Served page / component captures
Printing
Data sourcesCampbell Scientific CR200 and CR10(X) dataloggers, and the Inteltronics Instrumentation Data Collection Platform
File type pluginsCampbell Scientific array and table based file types, and Inteltronics Data Collection Platform file types
Developer
Frederick Le Roux
WeatherQuery graphical data display screenshot